Email marketing has become increasingly strategic, relying on data to create effective campaigns and measure their success.
Data-driven decision-making is becoming the norm for companies to make informed decisions that align with customer needs, preferences, and behaviors.
It is no different in the email marketing channel. The data collected provides insights into what is working and what is not.
The majority of brands fail to accurately measure their ROI, despite users having access to the necessary data to create effective strategies.
By identifying the right metrics that correspond to your business goals, you can easily drive growth. Let’s not underestimate the importance of tracking the right data points - they can make all the difference.
Whether you’re a seasoned marketer or a beginner, this article will surely help you make up your mind about email marketing metrics.
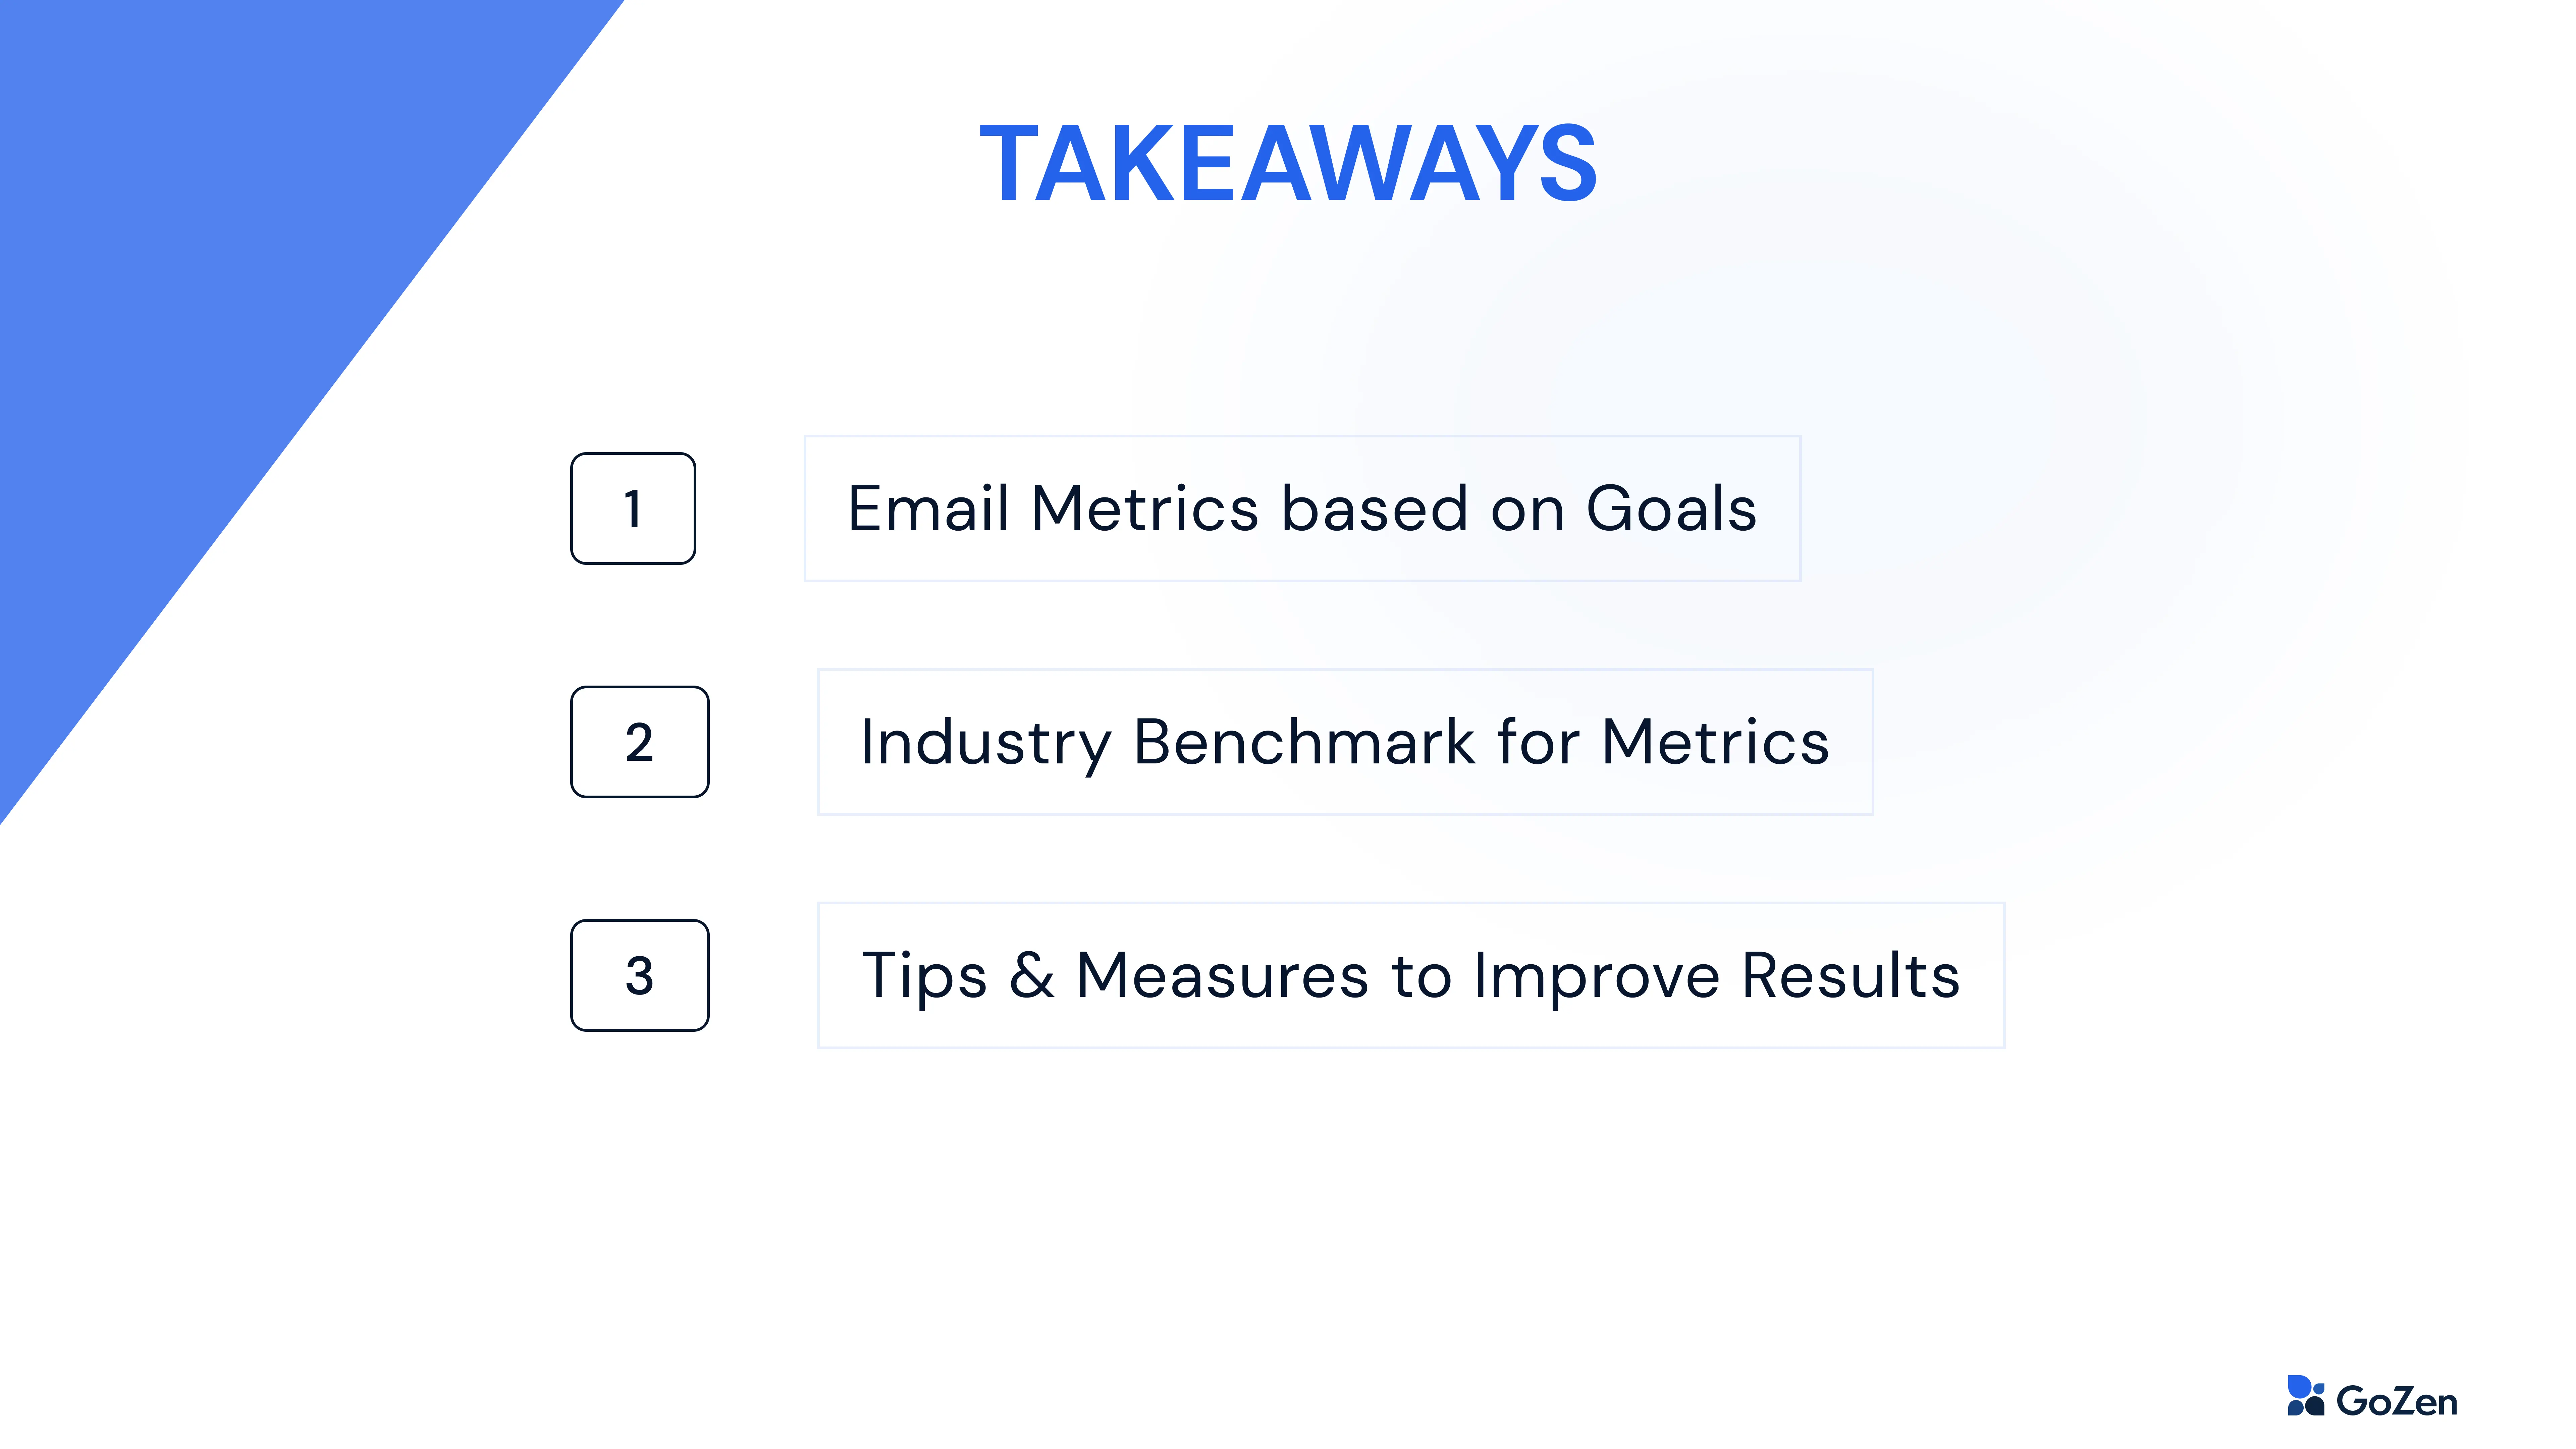
Table of Contents
Brand Awareness and Engagement Metrics
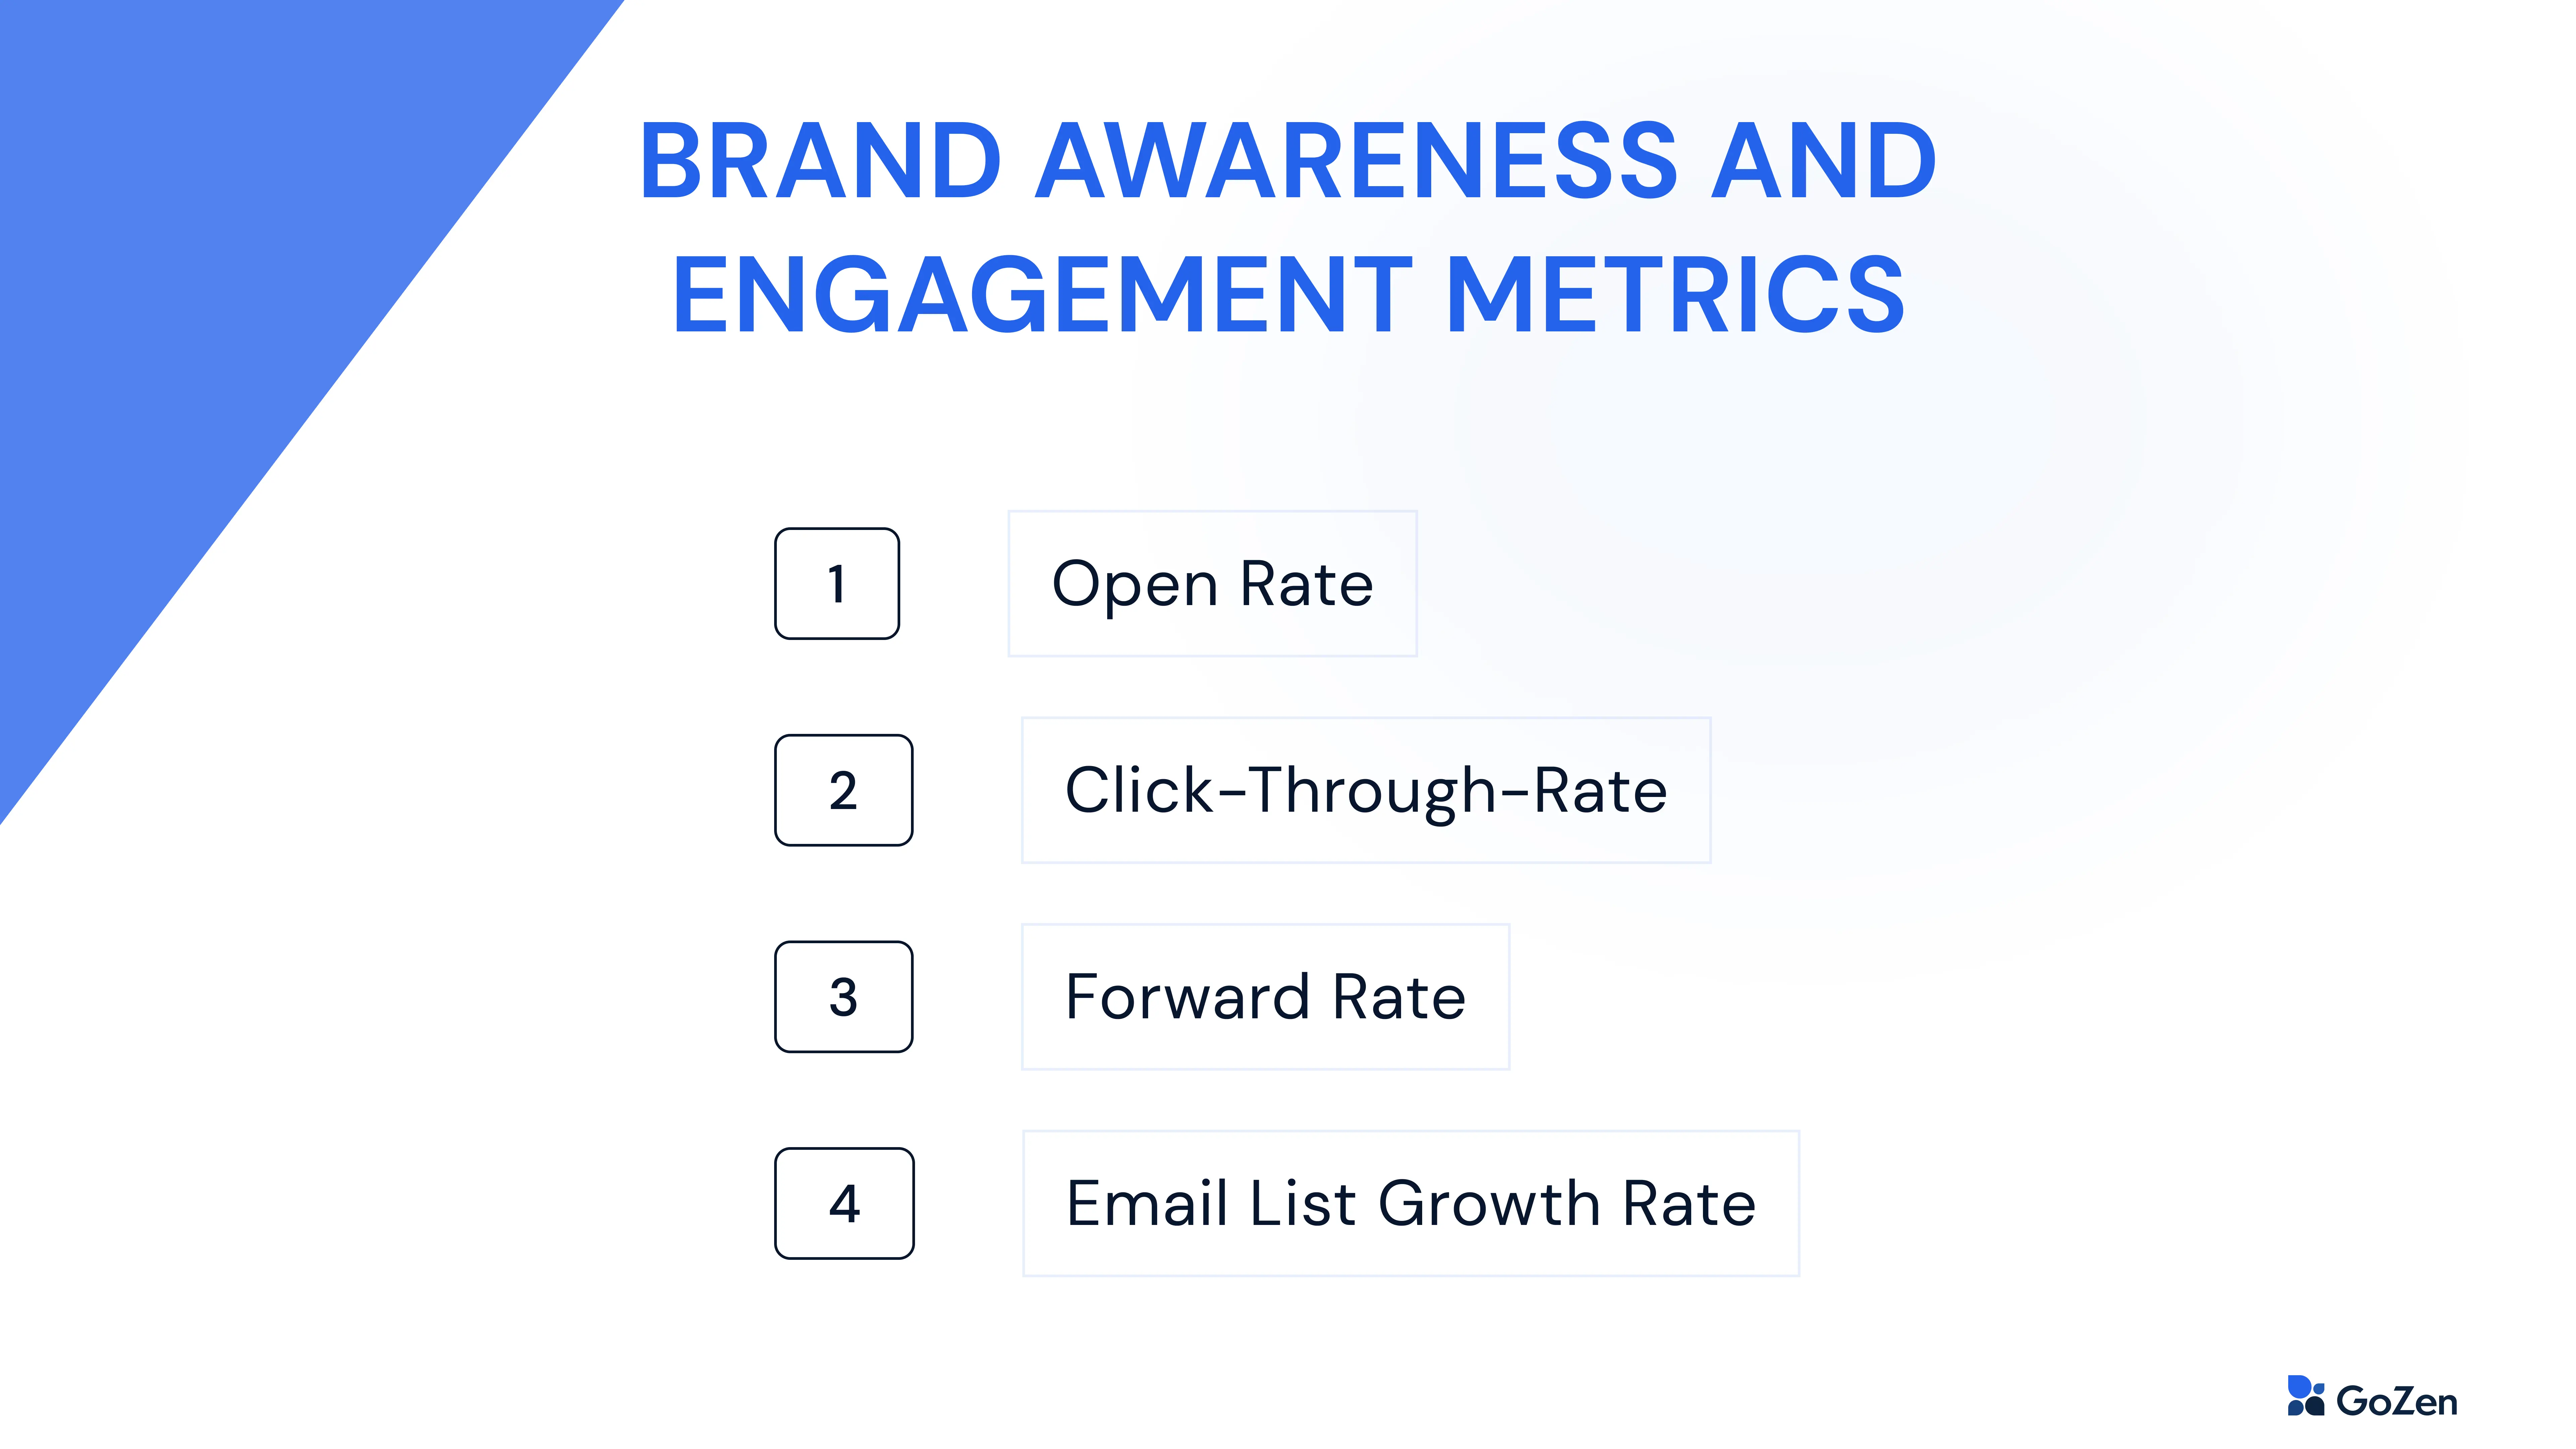
If your marketing goal is to send out valuable emails, engage your recipients, and increase awareness about your brand, prioritizing the following metrics can be a good move. This ensures you receive more visibility.
It further helps you expand your strategies for sales and conversion.
Open Rate
Open rates tell you how well your targeted campaign performs. Having a strong and appealing subject line has a direct impact on the rate at which your email has captured your audience’s attention.
We experimented with email campaigns and found that Personalization can easily boost your open rate to 40%.
Tips: Keep these in mind while writing your subject line,
- Write your email copy first.
- Write a bigger email copy and shorten it later.
- Then write your email subject line.
- Use personalization in the subject line.
Benchmark: Comparing your open rates to this benchmark can help you draw insights. The average open rate across all industries is found to be 38.49%.
Click-Through-Rate
This metric measures the percentage of clicks out of the total emails delivered. It indicates your email is receiving engagement.
We have found that Educational and Problem-Solving emails get sky-high CTR.
Our average CTR on our email marketing campaigns that are focused on promoting our product is 35% which is pretty good. How did we achieve it?
Tips:
- Focus on stating problems first and then solutions for your target audience.
- Keep the email copy less than 6 sentences. Longer emails only received around 9% CTR.
- Use soft CTA instead of writing forceful ones - E.g., Would you like to try the product?”
Benchmark: The average click rate across all industries in the year 2023 was found to be 3.01%.
Click-To-Open-Rate
Unlike CTR,CTOR calculates the percentage of clicks out of the emails opened. This helps highlight the percentage of unique clicks for every unique open.
Tips: CTOR finds the quality of each segment of your email content - giving an idea of how engaging it is.
Based on this, you can optimize your link text and where it can be placed, the subject matter, and the precision of your content. Add in a compelling CTA that can boost your CTOR.
Benchmark: You can compare to the average industry which is found to be 7.38%.
Forward Rate
Forward rate shows whether your content is worth sharing and whether it leads to acquiring new subscribers.
Knowing this, you can understand what type of content is of value to your targeted audience and can multiply that type for new leads.
Formula: It is calculated by this formula - The number of forwards divided by the total number of emails delivered.
Tips: The best way to let people take action is to ask for it. Remind them to share your email.
So, What’s in your control? Asking for it.
Whether they do share or not, it’s not in your control. But like with everything, if your email is good and valuable, They’ll surely forward it, and only if you ask for it.
Email List Growth Rate
It is as important to keep track of the growth of your subscriber list as it is to send out strategic emails.
Formula: You can calculate this by subtracting the number of unsubscribers from subscribers, then dividing it by the total number of your email list and multiplying it by hundred.
It is a good indicator of the overall performance of your marketing campaign. Benchmark: The average list growth rate is found to be 2.5%.
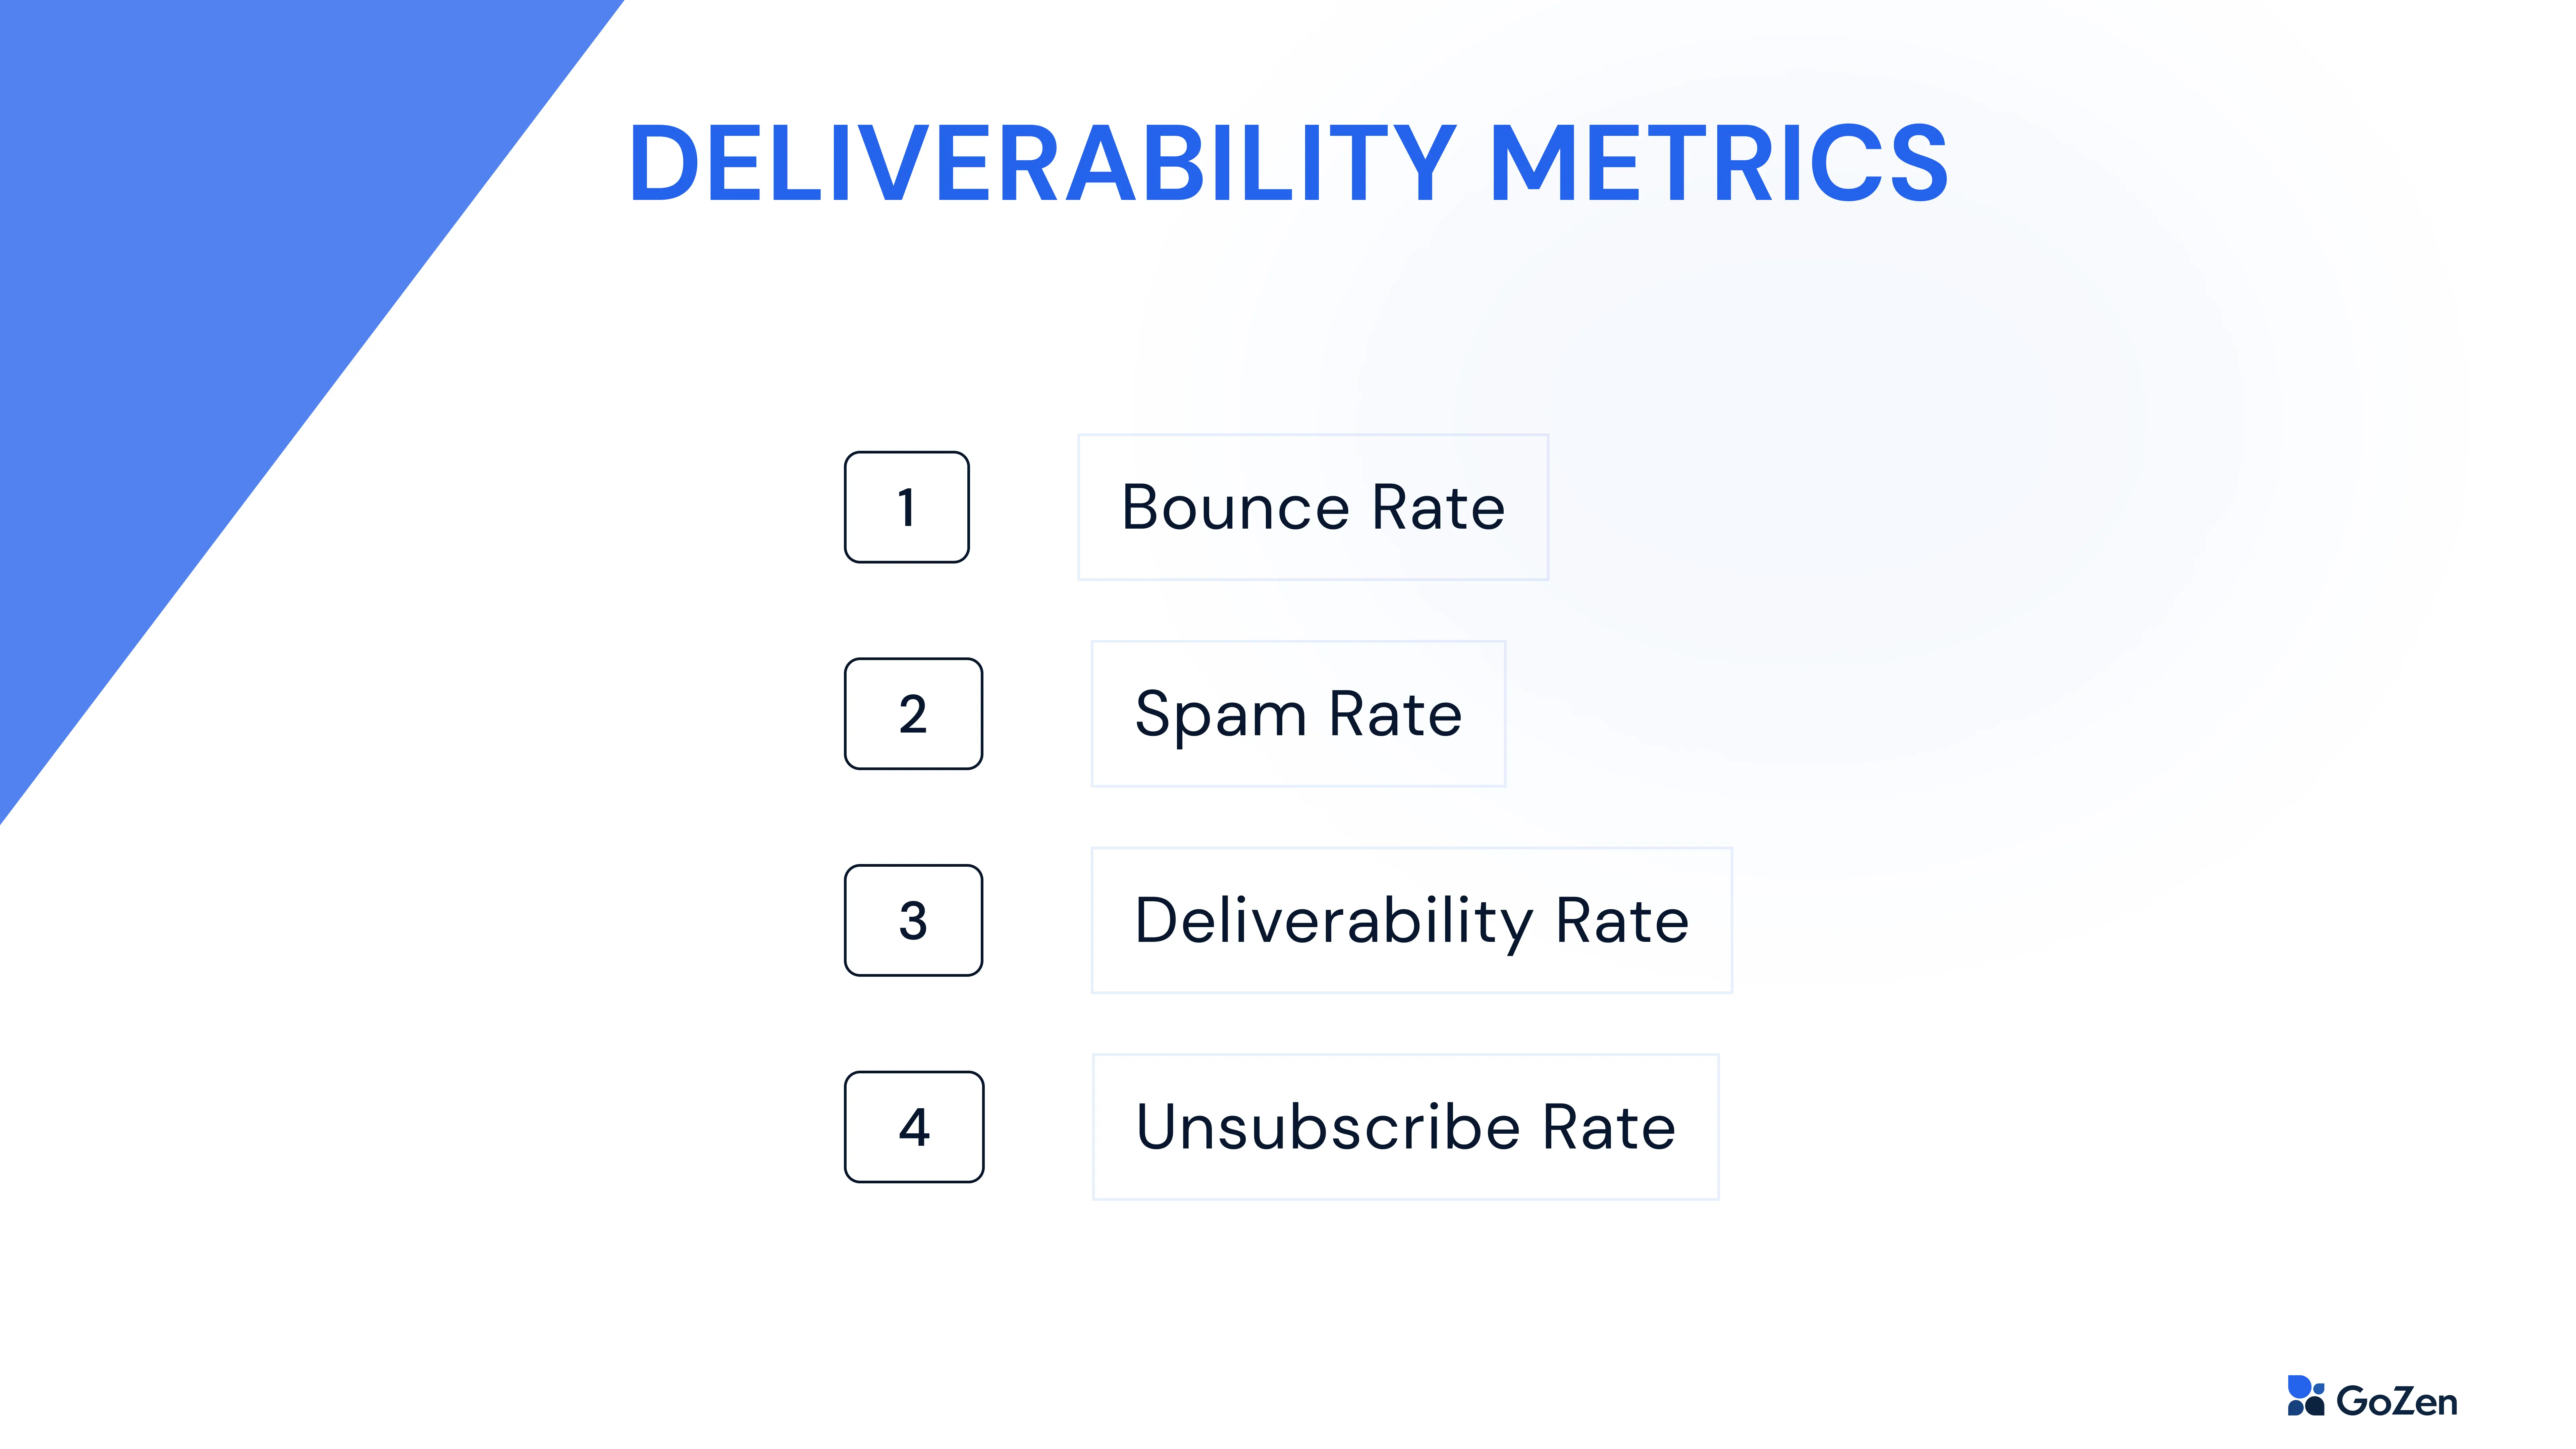
Deliverability Metrics
Bounce Rate
Bounces occur when your email remains undelivered to the recipient. They are categorized into two: Hard and Soft Bounces.
With hard bounce, there’s no chance of getting the email delivered to your recipient due to loss of email address, or invalid addresses. It affects your sender’s reputation and in turn, your email deliverability rate.
Soft Bounce delivery issues are fixable as they are temporary errors happening due to server issues, full inboxes, or spam filters.
Tips: Optimizing to avoid spam filters can increase your email deliverability rate.
Frequently ensuring email list hygiene by cleaning your lists, and getting only valid emails through opt-in procedure can also keep your bounce rate to a minimum.
Benchmark: The Average Bounce Rate - 0.41%
Spam Rate
Tracking your spam rate helps ensure your emails reach the desired inboxes and avoid being filtered as spam.
Formula: It is calculated by dividing the number of emails marked as spam to the total number of emails delivered, multiplied by hundred.
Your emails end up in spam due to unauthenticated sender addresses, low sender reputations, poor quality content, and email frequency. According to Mailmodo’s email report for 2024, marketers who warmed up their domain for 30-45 days increased their chances of landing in inboxes.
Tips: Boosting email deliverability is a breeze when you keep your list clean, collect valid emails, and keep your spam rate low.
Deliverability Rate
This is another email marketing success metric that decides the success of your email campaign by calculating the number of emails delivered to the inbox.
Based on a report from Mailmodo, marketers saw 50-70% inbox placement rates in the year 2023. This shows that deliverability is still a challenge to marketers.
Tips: Similar to spam rate measures, remaining in the good books of your email providers by maintaining a steady sender reputation, hygienic email list, and other email marketing best practices can help you avoid incurring ROI losses.
You can monitor deliverability and spam rates using Google Postmaster Tools.
Unsubscribe Rate
Unsubscribe rates tell you a lot more than you’d think. Does your content resonate with your audience? Is your email frequency too high? Are you targeting the right audience?
It is an indicator that you have to change strategies and initiate trigger-based sequences.
Tip: Having an optimal unsubscribe rate is not a bad thing, as it only keeps the wanted audience on your email list and boosts your open rate.
Benchmark: The average unsubscribe rates remain between 0.2-0.3%.
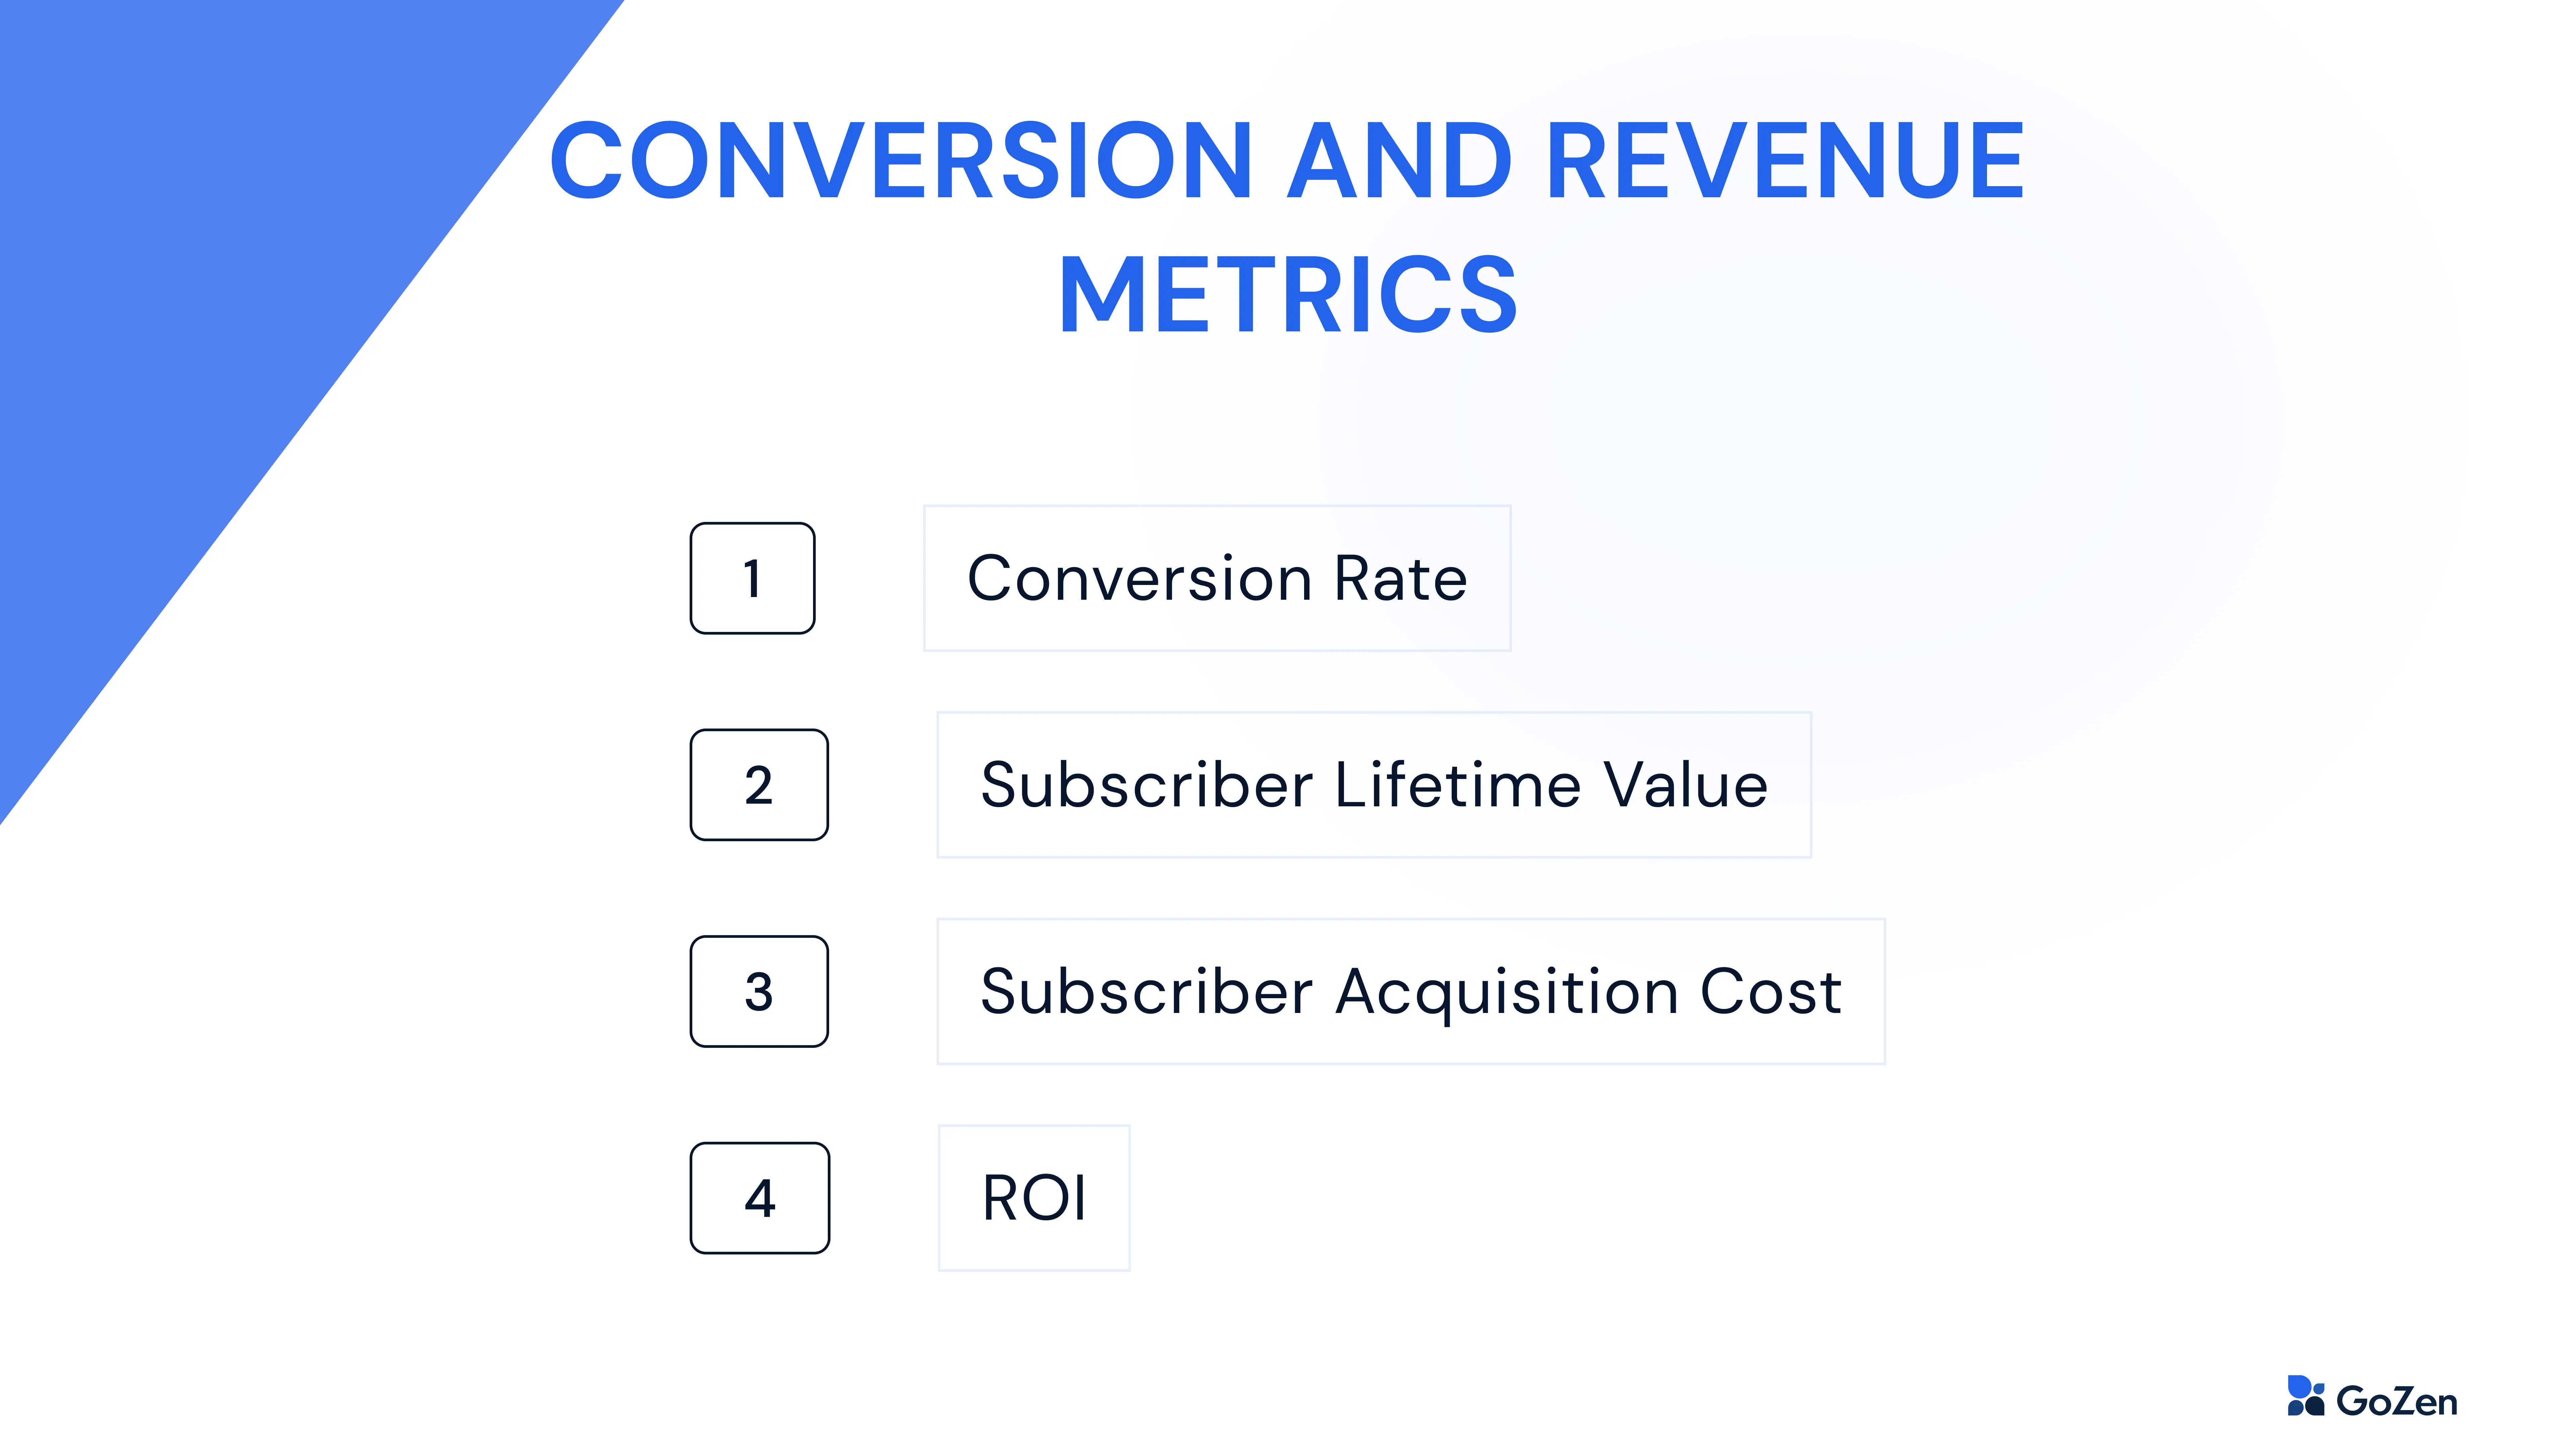
Conversion and Revenue Metrics
Your email marketing goals rely on generating leads, converting customers, and making returns. The end result marks the success (or failure) of your campaign.
Conversion Rate
Emails for businesses are meant to incite a response from your targeted audience: subscribe, download, register, and purchase. This metric calculates the number of subscribers who have completed the above actions.
If this is low, it denotes that your email campaign may not be performing well.
The average to this rate varies as what counts as conversion depends on the business and marketing goals.
Tip: Sending personalized emails, and boosting your opens and CTRs have a direct impact on conversion rate.
Subscriber Lifetime Value
The value generated by a single subscriber/customer over their time in the mailing list of the company is calculated under Subscriber Lifetime Value. It helps predict the lifespan of the customer with the company.
Tips: You can boost your retention rate by segmenting your audience and sending targeted personalized emails. This will help maintain customer loyalty which will, in turn, increase their value for the company.
The more the SLV, the more your revenue will be over time.
Subscriber Acquisition Cost
This refers to the marketing and sales expense of a company in acquiring a new subscriber over a specific time.
It is calculated to reduce your cost to get a new subscriber and to know if the subscriber’s lifetime value with your company is worth the expense.
Formula: The formula adds the cost of marketing and sales and divides by the number of new customers attracted.
Tips: Retaining customers and utilizing marketing automation tools can help reduce your subscriber or customer acquisition costs.
ROI
Any business would want to generate ROI from their marketing campaigns. This metric does that - track the ROI gained while comparing it to the investment.
Marketers have raised ROI up to 760% with email campaigns, making it the best channel for marketing, surpassing even social media.
There is no secret method to increasing ROI except ensuring your other metrics are performing well.
Current Best Practices:
AI has made data collection and analysis easier with these strategies.
Segmentation
Increase the relevancy of your content to your audience by segmenting them into groups based on similar characteristics and sending targeted emails.
Personalization
You can customize the emails by not just using names in subject lines, but by hyper-personalizing strategies that use their data and preferences to tailor persuasive messages.
Using tools like GoZen Growth that enables AI-powered personalization heightens the relevancy of your content and smartly segments your audience in no time.
62% of marketers leverage dynamic content to personalize their email marketing campaigns and most of them have seen an increase in open rates, engagement rates, and reduced subscribe rates.
The effectiveness of AI-powered personalization in emails can be calculated by the personalization score, user sentiment, and its impact on other email metrics.
Automation
Managing larger lists and sending emails has now become easier than ever due to automation, eliminating repetitive tasks. This can automatically gather data from various sources and manage your campaigns, increasing efficiency and speed.
A/B Testing:
You can split-test various elements of your email to see which engages your audience better.
By optimizing your emails based on data-driven insights, you can improve conversion rates and achieve your marketing goals more effectively.
Conclusion
The metrics may differ according to goals but eventually, tracking a combination of metrics can help you arrive at your milestones. Check your progress compared to benchmarks from the industry and your previous performance.
Additionally, focusing on user experience and measuring the impact of AI on campaign results can take your email marketing efforts to new heights of success.
Maximize your results and propel your business forward.
